Ask Visier: Who Are Your Highest Performers?
How can you tell who are your highest performers? Visier's Senior People Analytics Consultant explains why it matters and how people analytics makes it easy.

Ask Visier is a weekly column where a people analytics expert dives into one of the 2,000+ business questions available in Visier—and shares how to take action on the answers you might uncover on that topic.
Before we can answer this question, we first have to define what we mean by “high performers.” The highest performers in an organization are the ones who are “bringing in the most money,” “making the highest-quality products,” and “driving the most value and productivity out of the raw product that’s been given to them.” Knowing who those folks are can be important if you need to tweak the levers of production.
It’s important for HR leaders to answer this because knowing which employees are the most essential can help in times when an organization needs to increase output and wants to know who to rely on. If all your highest performers are maxed out and the mid- and low-performers can’t do it, you’ll know you need to hire more people.
Measuring this can be a challenge because the difference between the higher and the lower performers can be all over the place. Each company’s ruler for what makes a high performer is different. In the finance industry, the ruler might be based on how many million dollar accounts were closed, whereas in retail, the ruler might be based on how many crates get stocked on the shelves. Those are two completely different rulers. Even within the same industry, this can look differently. For example, in one school a 90% grade or better is an A, while at another, an A is a grade of 94% or higher.
How people analytics can help
Data analytics can easily tell managers, leaders, and HR professionals how much an employee has accomplished, how much they’ve spent, and how much each person has generated in revenue. From there, the analytics can tell you, based on your criteria, employee A is a mid-performer, employee B is a high performer, and employee C is a low performer. You can easily rack and stack the basic data from those employees to figure out the hierarchy based on which factors matter to you. Even better, it can show distribution so you can see if all your rock stars are clustered in one location, or if you have gaps where you need additional resources.

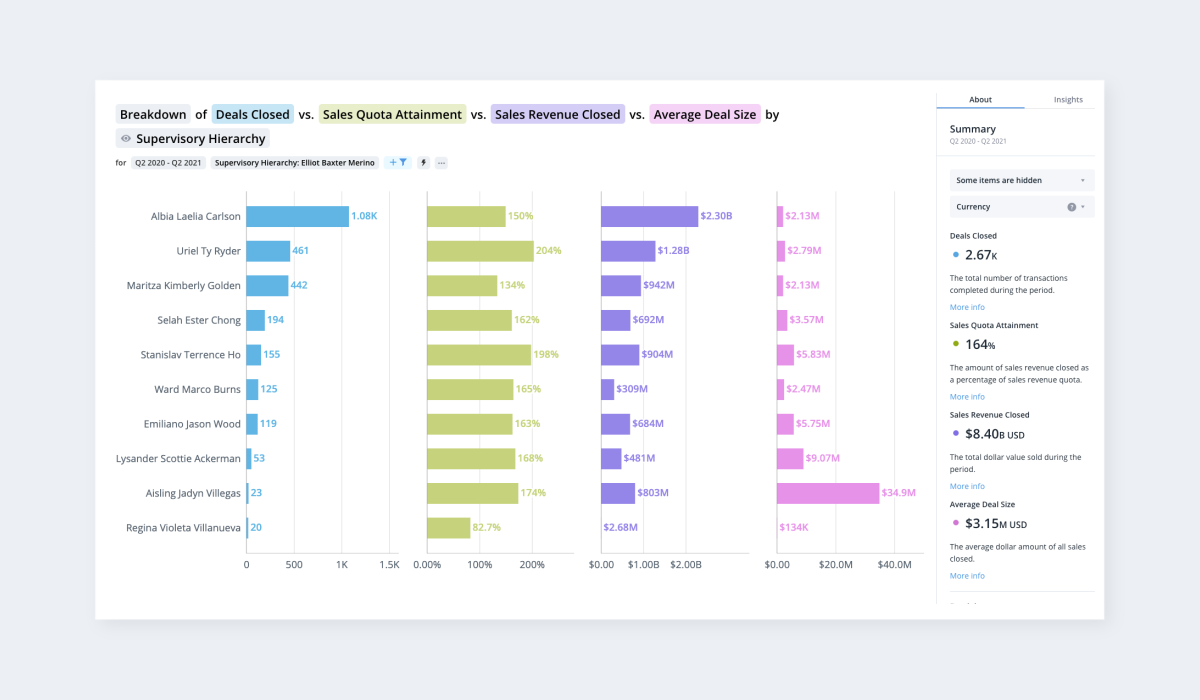
Breakdown of deals closed, sales quota attainment, sales revenue closed, and average deal size in Visier.
To get the full picture, gather important data, such as 360-degree feedback surveys in which you interview everyone an employee has contact with. The results of this kind of survey will let you know how the employee relates with customers, direct supervisors, and their peers. For example, one set of data may show that someone has longer completion times, but anecdotal evidence can build out the full picture of someone who is competent and methodical rather than just slow.
Other ways of gathering data include follow up surveys after customer interactions or ticket completion. These can give you a convenient number score from which you can pull metrics, though they don’t give the full picture.
Having the answer to this can give a company a competitive advantage by highlighting discrepancies. For example, let’s say your internal IT department is backed up and it takes a full week before new hires have the software licenses they need to do their jobs. That’s a lot of wasted resources. Looking into it can reveal who’s doing well and who’s doing poorly, but it also shines a light on other problems. If one department has consistently bad performers, maybe they need more training, are understaffed, or lack the tools they need.
Why is it a challenge to answer this without Visier?
Visier helps collect information beyond just the normal “how many people do I have.” You can get performance ratings, survey results, and other pieces of information collected and displayed in different visualizations to identify high performers, mid performers, and low performers. Without Visier, it can be a challenge to correctly calibrate performance metrics. Some organizations have a disconnect between productivity and performance, with very high scores for employees who weren’t producing that much, and lower scores for the top performers. That indicates either performance management was misaligned or the employees with lower scores were taking more time but their quality was higher.

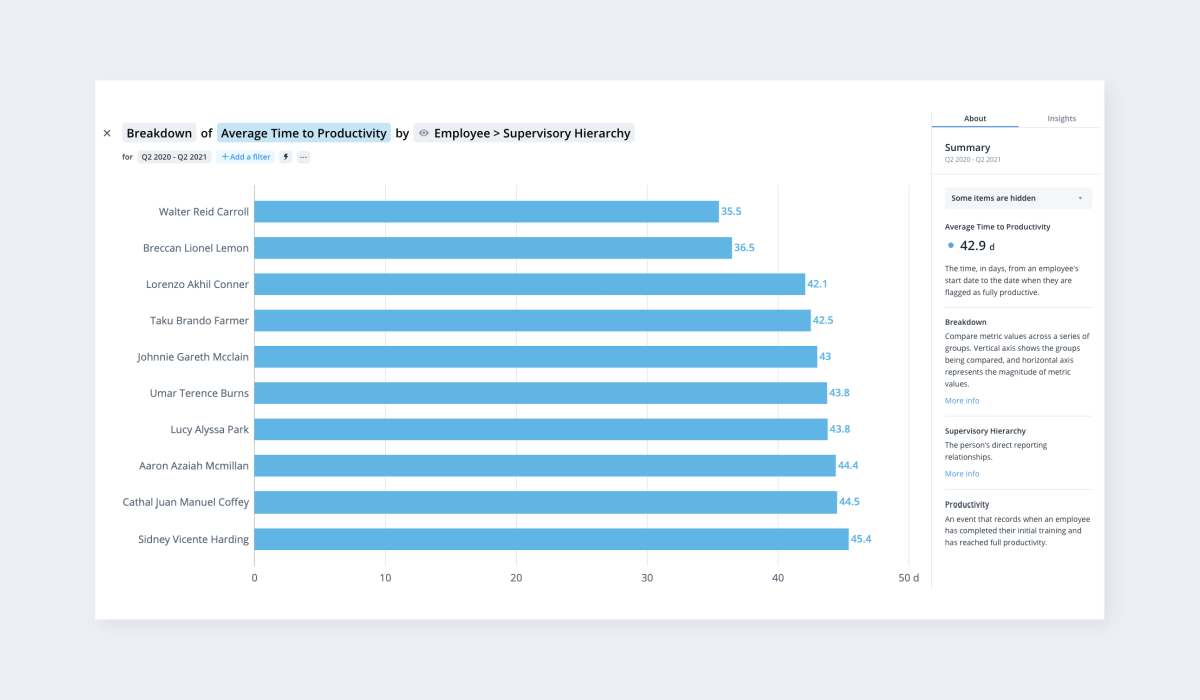
Breakdown of the average time to productivity in Visier.
Visier is also handy because it has such strong privacy tools. You can’t inadvertently spill all the data on your organization. Visier puts in a number of safeguards so that uncovering the data requires deliberation. This is important because it is sensitive information that needs to be maintained and viewed by people who need to know and no one else.
In one example of the positive impact of knowing who your high performers are, we had a client who previously had a poor system of judging good performers. They had been measuring sales success by the number of calls taken in a day, which gave a skewed result. We took a look at their process and realized that a better metric was what percentage of the calls resulted in a sale. By changing the methodology and looking at different metrics, employees took more time with calls. By this one change, our client was able to nearly double the percentage of calls which resulted in sales without adding headcount.
There’s a value in being able to tell which of your employees are the highest performers. But if you want to know who your best people are, you need solid data. Just going by hunches or arbitrary metrics isn’t going to give managers the transparency they need to make good decisions.
Learn more about people analytics and performance:
Get Outsmart content straight to your inbox
Subscribe to the People Insights Monthly newsletter for actionable insights and stories.
Subscribe now