Analytics in Context: Embedded Analytics Add Insights Where They Matter
Contextual analytics delivers answers directly in the platforms people already use, bringing data and insights into the ways they already work. Learn how to combine the power of contextual and embedded analytics here.

Imagine that your software application was a house. By adding analytics to your platform, you’re renovating that house—making it more modern, usable, and efficient.
In the past, embedding analytics was like an annex built onto the side of your home. You’ve greatly improved the structure, maybe adding a more efficient kitchen or a washroom that wastes less water.
But to access the new part, you’ll need to intentionally walk that way.
Contextual analytics is more like upgrading the whole interior. You might add stronger flooring, more energy-efficient insulation, or brighter lights that let you see more clearly. Throughout the home functionality is improved, giving you better usability and improved results.
Contextual analytics is embedded analytics’ next evolution. It’s about sharing charts, visualizations, and insights in context—integrated throughout your platform, where they are relevant to users’ work.
What is contextual analytics?
Traditionally, embedded analytics took the form of reports and dashboards. They were part of the software application, but existed as a separate module within it.
Contextual analytics breaks down that distinction. Users don’t need to navigate away from work and enter the dashboard to access data. Instead, those visualizations and insights are ready where and when they need them.
Embedded analytics is still incredibly valuable. Distilling data into insights and suggestions, ready for people to act on, can completely transform how we work. It lets us make stronger decisions, every time—decisions that affect the lives and livelihoods of our people
But people still need to actively seek out those answers to make better choices, changing how they work—and often, putting in extra labor.
That’s why contextual analytics is the next iteration. Like embedded analytics, it gives people answers in the virtual workspaces they already use.
But now, analytics is integrated throughout the platform. Data-driven decision-making becomes a natural extension of how users work.
People-centered analytics
Modifying human behavior is hard. Expecting already busy people to add additional steps to their workflow is even harder.
This new approach to embedded analytics reflects a growing demand to bring data and insights into the ways we already work, rather than putting the onus on workers to find them.
Because it removes friction and doesn’t create extra work for the user, it’s a more realistic way to ensure adoption, and make sure your customers are actually getting the business value embedded analytics offers.
Contextual analytics lets users make data-driven decisions more quickly, without changing how they already work. It reduces friction, bringing people answers where and when they need them.
Contextual analytics in practice
What will embedded visuals look like in your product?
It’s entirely dependent on your customers' data and what they need from it. A payroll provider’s users will have different questions—and need different answers—than a professional employer organization, or learning platform.
But no organization, in any industry, can exist or get work done without people.
While they will all have different questions, anyone who makes decisions about people, from managers to C-suite leaders to HR administrators, will benefit from insights that back up their intuition, and let them make choices with confidence.

Embedded Visuals: Contextual analytics in Visier
Through Embedded Visuals, contextual analytics are available to all Visier’s Embedded partners, right within the platforms they already use.
True to the contextual analytics form, Visier’s Embedded Visuals don’t require users to initiate a separate session and disrupt the flow of work.
With Visier Embedded Analytics, specific curated visuals can be added to separate pages of your product in accordance with their individual use-case.
Or, a selection of key visualizations could be added to the home page, displaying an overview of that day’s data or general market trends.
Any of these embedded visuals could provide a jumping off point for further inquiry—the user simply clicks through to the main analytics environment, where they can slice, dice, and analyze the data further.
Like the rest of Visier’s analytics product, embedded visuals go far beyond basic reporting to provide guided analysis. Users aren’t just presented with basic charts or visualizations, but the meaning it contains, in the form of insights, questions and answers, or trends and changes within the data.
But unlike in conventional embedded analytics, those answers are immediately available, within the virtual work environment where customers need them.
To gain depth or answer more complex questions, the user can then navigate through to the main analytics module—and they’ll arrive there with a sense of purpose.
Embedded in action: contextual analytics for payroll
One Visier partner used embedded visuals to more than double user engagement with their product’s embedded analytics. After adding contextual visuals to their conventional embedded analytics, they increased adoption by 213%.
The idea of embedded visuals came about when our partner wanted to see how they can leverage insights more throughout their product. They saw the value of analytics and wanted a solution to increase user adoption and overall engagement throughout their customer base.
Kate Zhu, Solutions Developer at Visier
“Among users who were previously the least engaged with analytics, we are now witnessing an increase in accesses. Exposing the end users to critical data points has proven to successfully raise their awareness of the analytical product and empowered them to explore further within Visier’s application,” shares Kate.
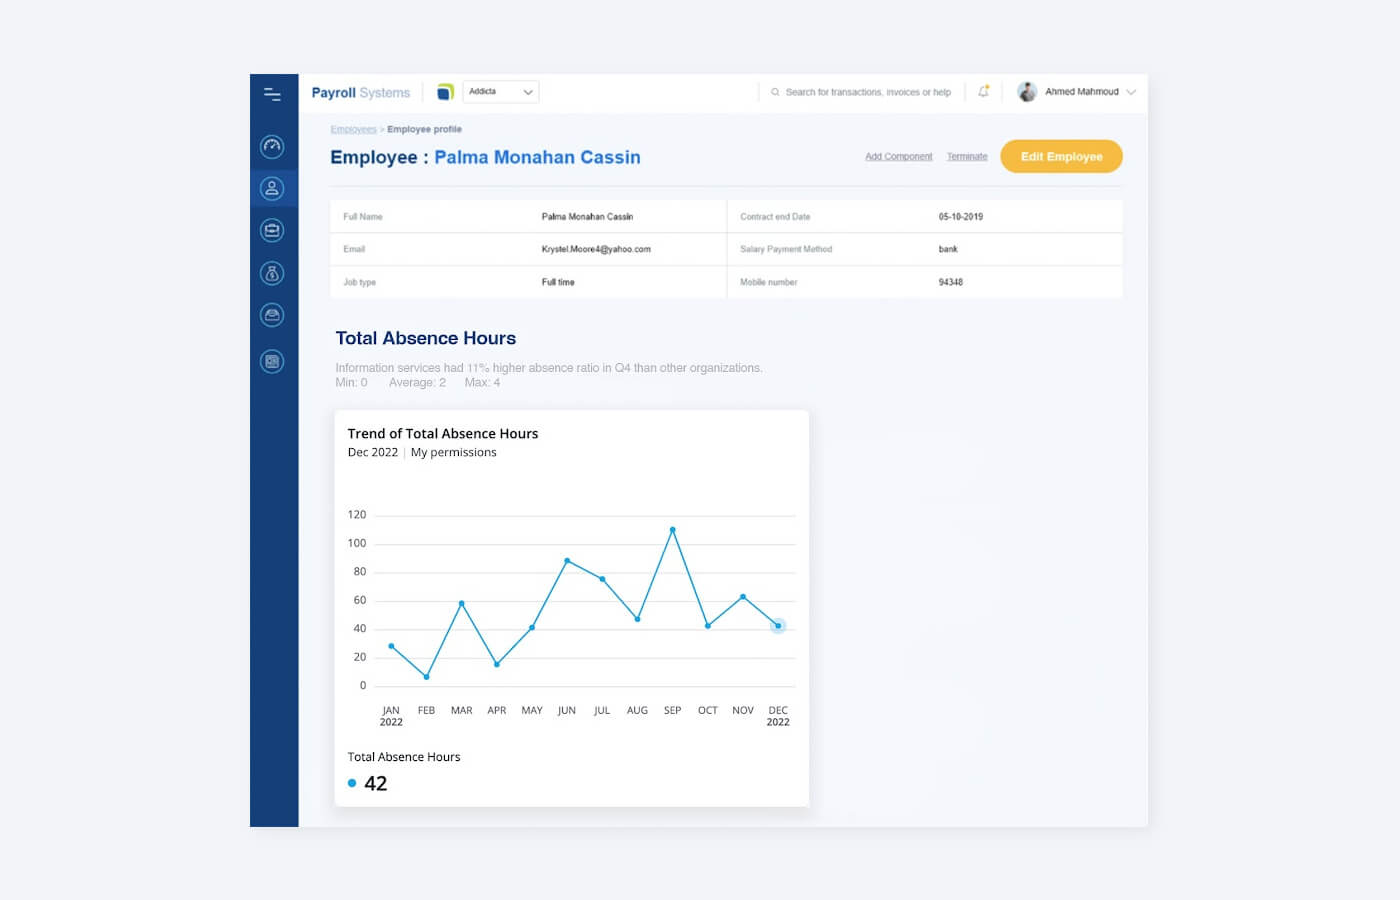
How it could look: a sample embedded visuals workflow for payroll
A people manager logs into their payroll solutions to approve an employee’s time off request.
On that page, an embedded chart shows them that the total number of absence hours for their team in this month is much higher than for the same time last year. They’re prompted to ask:
What’s causing this?
Is there an underlying team morale issue?
Are people getting burnt out?
Does high absence rate impact the team’s productivity?
To find answers, they click through to the main analytics module, powered by Visier, to look into that dynamic chart more deeply. They can look for key factors driving that trend in absent hours, break it down by demographics, look more closely at the timeline, or take a number of other actions.
Because these alarming signals surfaced in their day-to-day workflow, before impacting crucial work, they have ample time to investigate, and take actions to mitigate any potential risks.

Figure 1: Example of an embedded visuals workflow for payroll
Answers built for how people work
If large-scale adoption is the goal, analytics must demand as little as possible of their users.
If embedded analytics solutions ask users to modify their habits, even a little bit, they will simply be less successful than those that don’t.
We need to create human-centric, user-friendly systems that are so intuitive, using them is the path of least resistance.
If analytics become truly integral to applications we rely on, evidence-based decision making will no longer be something to aspire to. It will simply be how we work.
To help your customers make better decisions, every day, get more information on how Visier Embedded Analytics can evolve your analytics capabilities.
Ready to learn more? Continue Reading:
Scaling Small But Mighty Teams: How SMBs Can Run HR Like Enterprises With Visier Embedded Analytics
How Predictive People Analytics Helps Businesses of All Sizes Thrive
How Embedded Analytics Work: Embedding Visier into Your Product
On the Outsmart blog, we write about workforce-related topics like what makes a good manager, how to reduce employee turnover, and reskilling employees. We also report on trending topics like ESG and EU CSRD requirements and preparing for a recession, and advise on HR best practices how to create a strategic compensation strategy, metrics every CHRO should track, and connecting people data to business data. But if you really want to know the bread and butter of Visier, read our post about the benefits of people analytics.
Get Outsmart content straight to your inbox
Subscribe to the People Insights Monthly newsletter for actionable insights and stories.
Subscribe now